A maintenance engineer once spent days troubleshooting a flow meter issue, only to realize he misinterpreted the basic installation diagram. Clear understanding saves time and money.
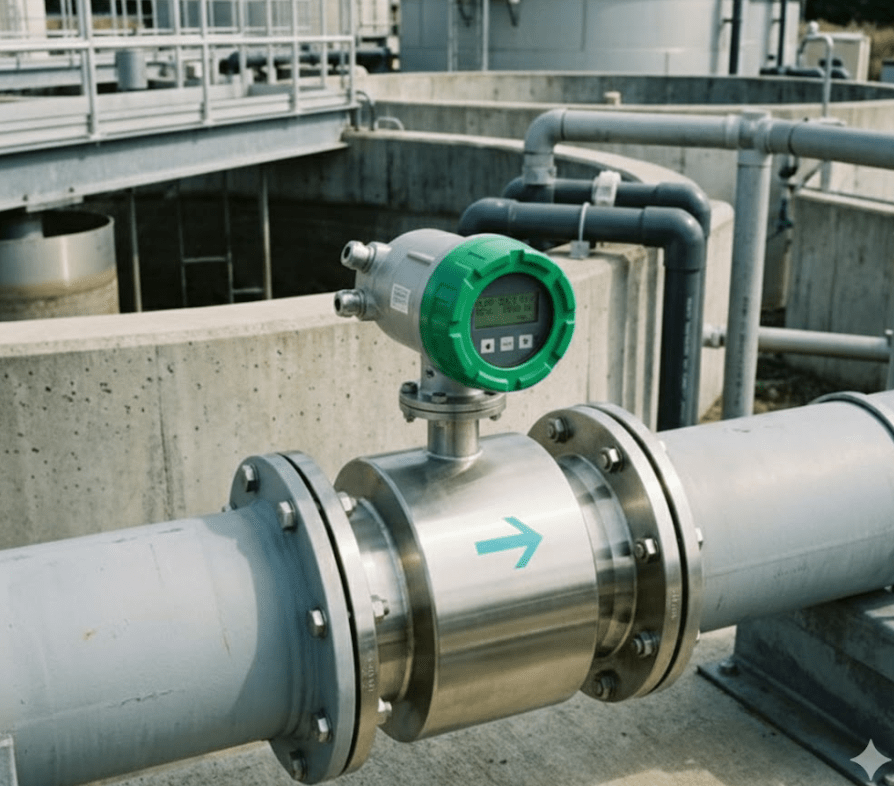
Transit-time ultrasonic flow meter diagrams are essential technical documents that illustrate sensor placement, signal paths, and installation requirements. They help ensure accurate measurement and proper maintenance.
Transit-Time Flow Meter Basic Diagram
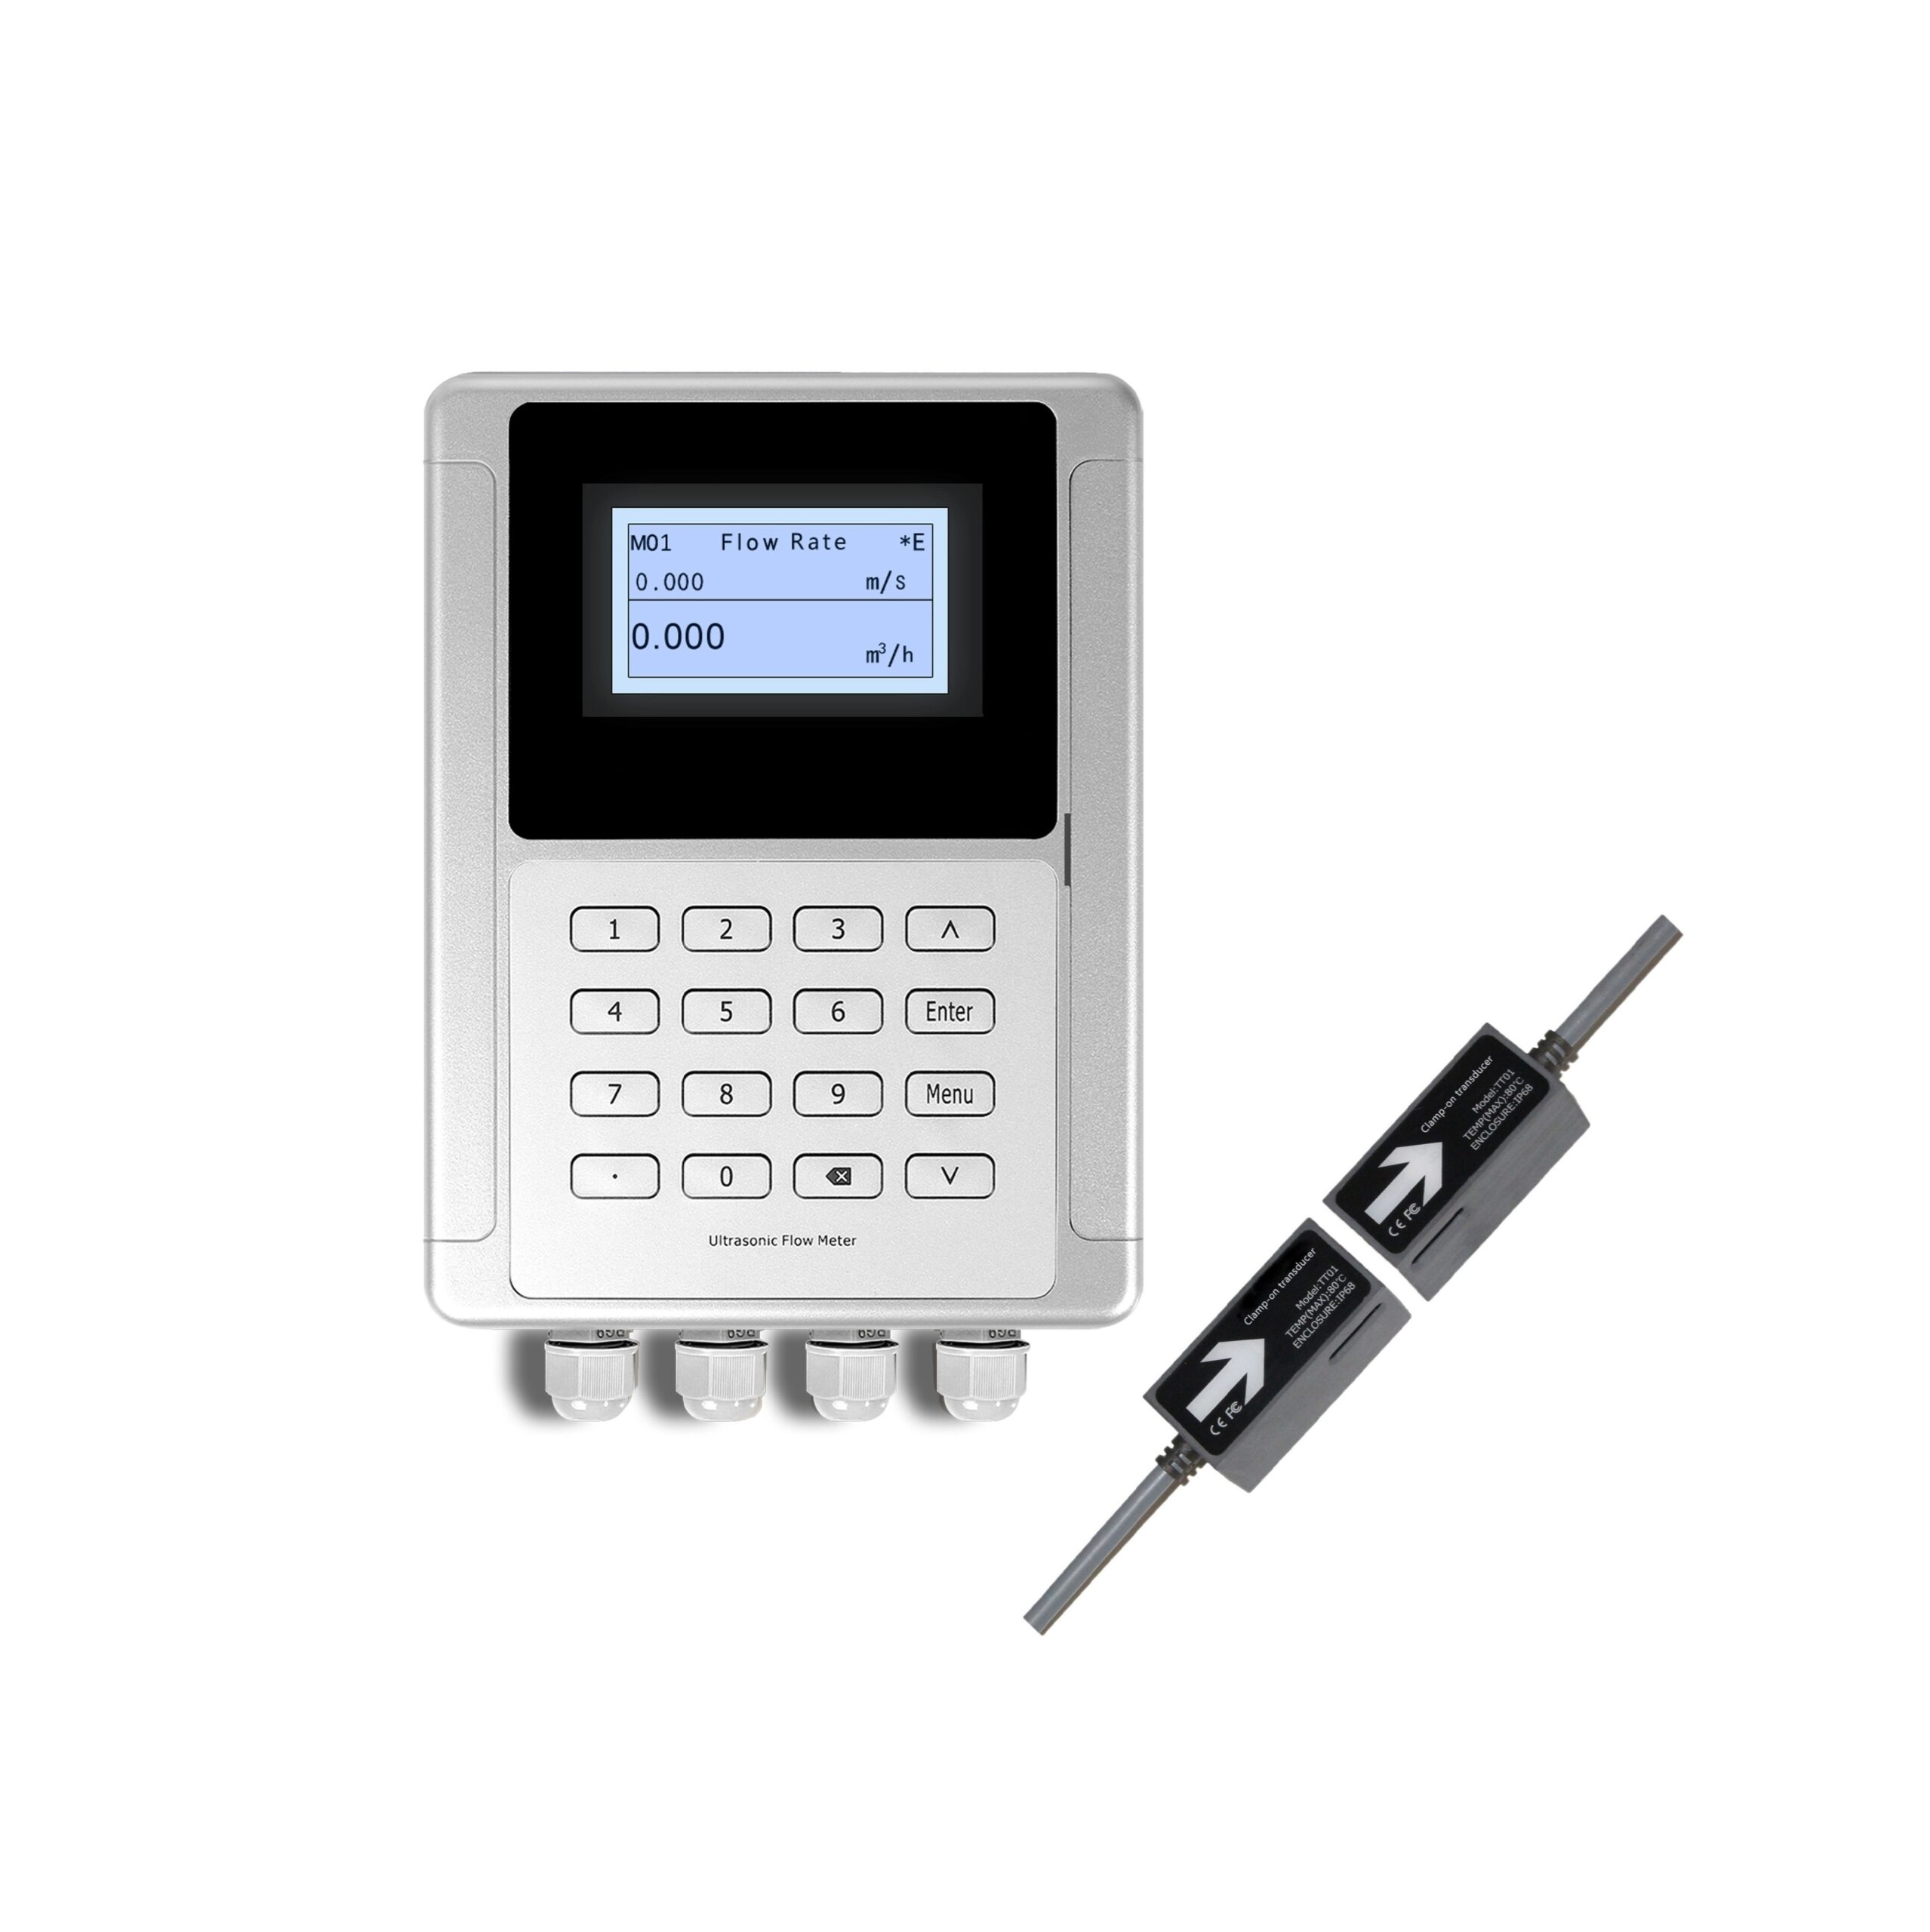
| Performance | |
|---|---|
| Flow Rate | ±0.03m/s~±12m/s |
| Accuracy | ±1% of measured value |
| Repeatability | 0.2% of measured value |
| Linearity | ±1% |
| Pipe Size | DN25-DN1200 |
| Function | |
| Output | Analog output: 4-20mA, Max. load 750Ω ;Pulse output: 0~10KHz |
| Communication | RS232/RS485 Modbus(M-Bus or Hart is optional) |
| Power Supply | 10-36VDC / 90-245VAC |
| Display | 240*128 backlit LCD |
| Temperature | Transmitter:-20℃–60℃;Transducer:-40℃–80℃(TT01,TT02);Transducer:-40℃–130℃(TT03,TT05);Transducer:-40℃–180℃(TT02H);Transducer:0℃–65℃(TT02S);Transducer:0℃–135℃(TT03S) |
| Humidity | Up to 99%RH, non-condensing |
| Physical | |
| Transmitter | PC+ABS, IP65 |
| Transducer | Enccapulated design IP68;Double-shielded transducer cable;Standard/Max. cable length: 30ft/1000ft(9m/300m) |
Let me share my experience in helping clients understand and utilize these crucial technical resources effectively.
How Do Transit-Time Flow Meter Diagrams Explain Working Principles?
I recently helped a new technician grasp the concept in minutes using our detailed diagrams. Visual aids make complex principles simple.
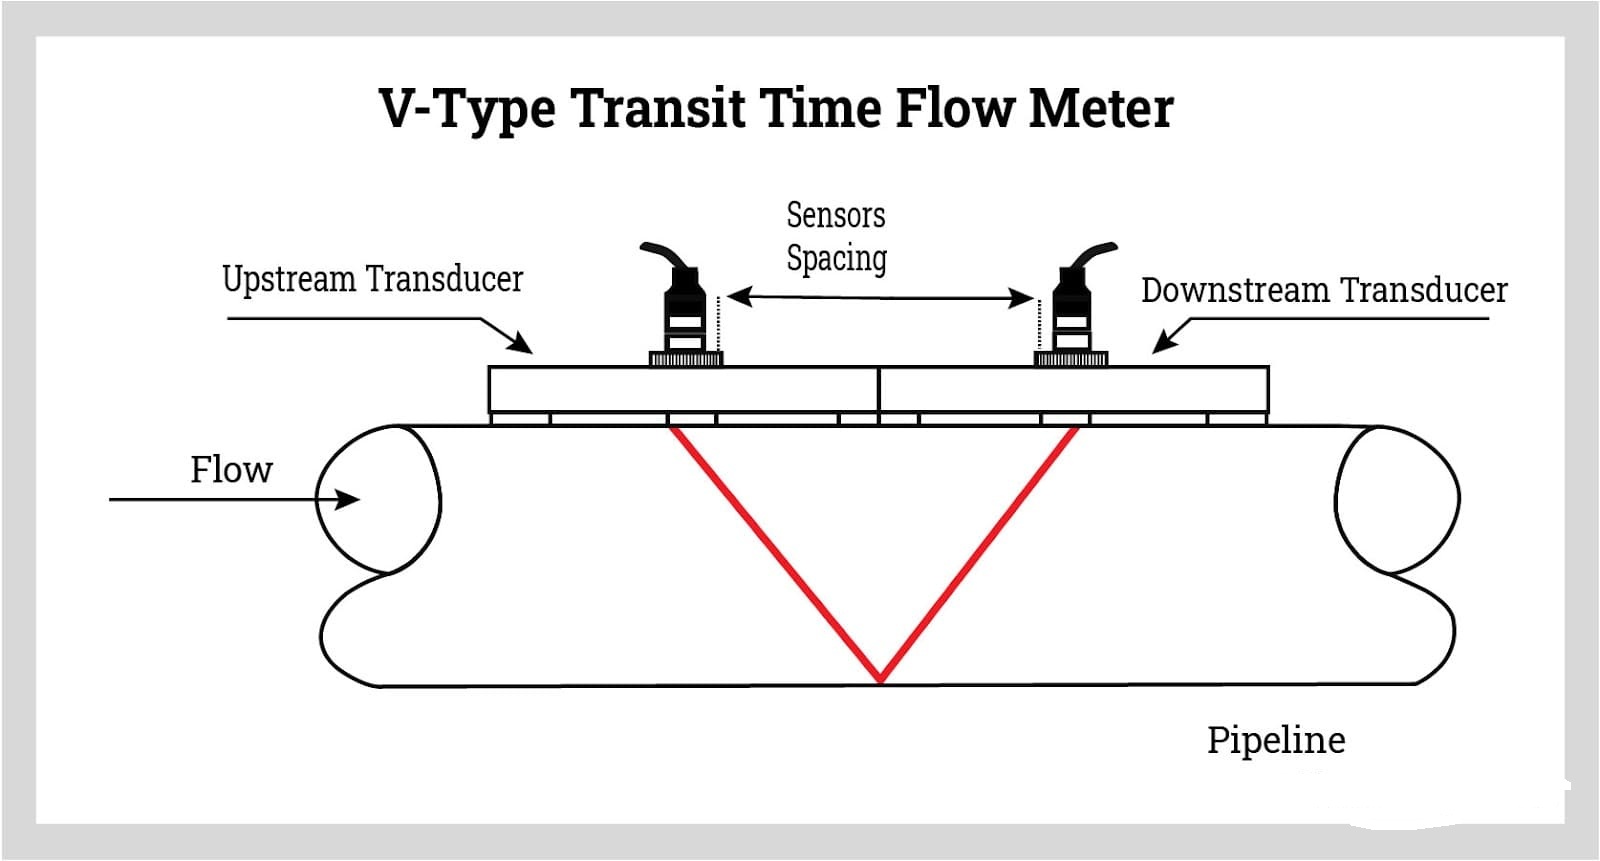
The diagrams show how ultrasonic signals travel between transducers in upstream and downstream directions, illustrating how flow velocity affects transit time differences.
Working Principle Illustration
Key Diagram Components and Their Functions
Signal Path Representation
Component Function Visualization Importance Transducers Signal emission/reception1 Mounting points Critical Acoustic path Signal travel route2 Diagonal lines Essential Flow direction Reference orientation Arrows Fundamental Mounting angle Installation guide Degree markers Precise Signal Analysis Elements
- Transit time calculation
- Flow velocity correlation
- Signal strength indicators
- Error detection points
How Do Component Layouts Impact Flow Measurement?
A customer improved accuracy by 2% simply by correcting transducer placement based on our detailed layout diagrams.
Component layout diagrams show critical spacing, orientation, and mounting requirements that directly affect measurement accuracy and reliability.

Component Layout Details
Understanding Layout Requirements
Installation Specifications
Parameter Requirement Impact Verification Straight run Min. length Flow profile Visual check Sensor spacing3 Calculated Signal strength Measurement Mounting angle Precise Accuracy Level tool Cable routing4 Protected Signal quality Inspection
How Do Diagrams Help Optimize Measurement Accuracy?
My team used installation diagrams to achieve 0.5% measurement accuracy in a challenging chemical plant application.
Diagrams provide visual guides for optimal sensor placement, proper alignment, and required straight pipe runs to ensure maximum measurement accuracy.

Accuracy Optimization Guidelines
Accuracy Enhancement Techniques
Critical Parameters
Factor Diagram Element Optimization Result Flow profile Straight run Length guidance Stability Signal path Angle marking Precise mounting Strength Interference Spacing guide Noise reduction Clarity Installation Step-by-step Proper setup Reliability
What Are Common Diagram Interpretation Mistakes?
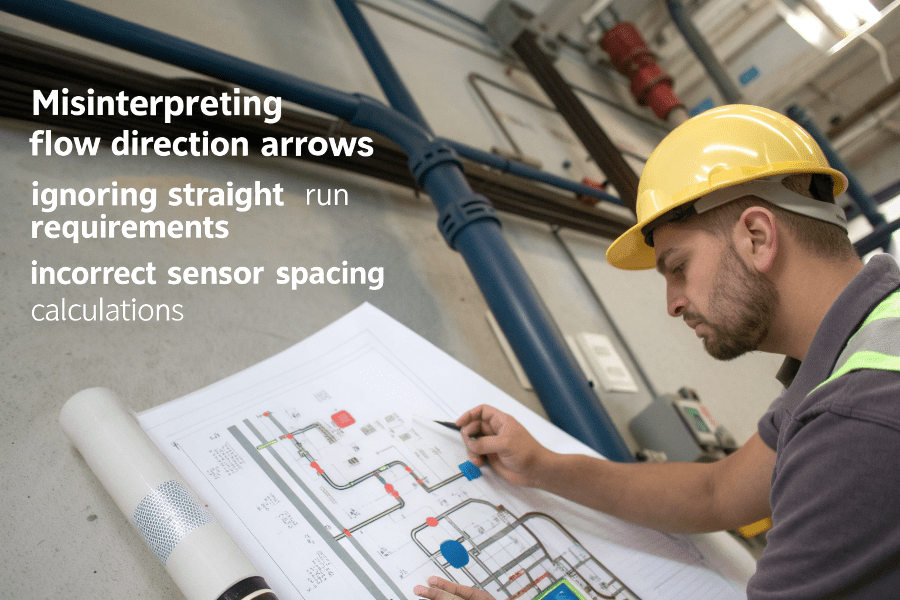
Last week, I corrected a critical installation error caused by misreading pipe orientation markings in the diagram.
Common mistakes include misinterpreting flow direction arrows, ignoring straight run requirements, and incorrect sensor spacing calculations.
Common Installation Mistakes
Avoiding Interpretation Errors
Critical Checkpoints
Error Type Impact Prevention Verification Direction Reverse flow Arrow check Flow test Spacing Weak signal Calculate Signal strength Orientation Poor accuracy Level check Performance Mounting Signal loss Guide follow Echo strength
How Do Diagrams Aid in Troubleshooting?
A plant manager saved $5,000 in service calls by using our diagnostic diagrams to solve signal issues independently.
Troubleshooting diagrams show common fault patterns, signal analysis points, and step-by-step diagnostic procedures for efficient problem resolution.
Troubleshooting Diagram Guide
Diagnostic Process Implementation
Problem-Solving Steps
Issue Diagram Use Solution Path Validation No signal Connection check Point-to-point Signal test Weak reading Position verify Adjustment Strength check Noise Interference source Isolation Clean signal Accuracy Setup review Optimization Verification
Conclusion
Understanding transit-time ultrasonic flow meter diagrams is crucial for successful installation, operation, and maintenance. They provide essential visual guidance for optimal performance.
Need help interpreting your flow meter diagrams? Contact our technical team for expert assistance.
Understanding signal emission and reception is crucial for optimizing transducer performance in various applications. ↩
Exploring the acoustic path can reveal insights into improving signal quality and efficiency in sound transmission. ↩
Understanding sensor spacing is crucial for optimizing signal strength and ensuring accurate measurements. ↩
Proper cable routing is essential for maintaining signal quality; explore this link for expert tips and guidelines. ↩