Misinterpreting radar echo curves can lead to incorrect level measurements, process inefficiencies, and costly maintenance issues.
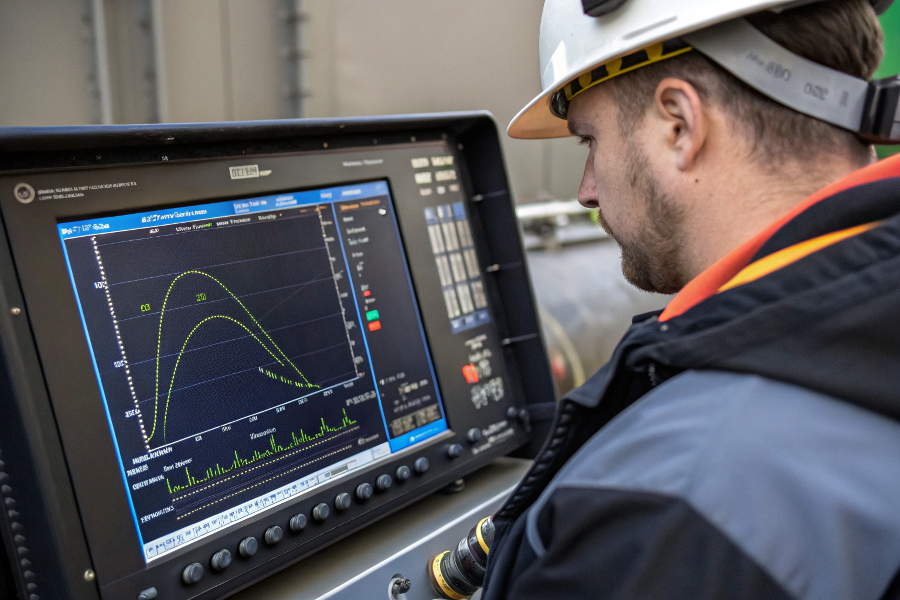
A radar echo curve is a graphical representation of signal strength versus distance, showing reflected signals from the measured material and potential interference sources.
Radar Echo Curve Basics
Let me share my experience in interpreting echo curves to help you optimize your measurements.
How to Read Radar Echo Curve?
Many technicians struggle to interpret echo curves correctly, leading to poor measurement performance.
Echo curves show signal amplitude peaks that represent reflections, with the strongest peak typically indicating the actual material level.
Reading Echo Curves
From my troubleshooting experience:
Echo Curve Components
Key Elements
Component Indication Significance Main peak Material level Primary measurement False echoes Interference Potential issues Noise floor Background Signal quality Signal strength Reflection power Reliability Curve Analysis
- Peak identification
- Signal strength evaluation
- Interference detection
- Distance correlation
Interpretation Guidelines
Analysis Steps
- Baseline assessment
- Peak verification
- Pattern recognition
- Trend analysis
Common Patterns
- Clean signals
- Multiple reflections
- Interference patterns
- Signal loss
Understanding these patterns improves troubleshooting efficiency.
What is an Echo Curve?
Engineers often misunderstand the fundamental purpose of echo curves.
An echo curve displays the radar signal’s journey through the tank, showing reflections from the material surface and other objects in the signal path.
Echo Curve Explanation
Based on my field experience:
Echo Curve Fundamentals
Basic Principles
Aspect Description Purpose Signal path Transmission route Measurement basis Reflections Return signals Level detection Amplitude Signal strength Quality indicator Time of flight Distance calculation Level computation Display Elements
- Time axis
- Amplitude axis
- Reference markers
- Threshold lines
Application Benefits
Diagnostic Uses
- Problem identification
- Performance monitoring
- Installation verification
- Maintenance planning
Optimization Tools
- Signal processing
- False echo mapping
- Threshold adjustment
- Range optimization
Echo curves provide valuable diagnostic information.
What is an Echo Signal in Radar?
Understanding echo signals is crucial for accurate level measurement.
An echo signal is the reflected microwave energy that returns to the radar sensor after hitting the material surface or other objects in the measurement path.

Echo Signal Details
Here’s what I’ve learned:
Echo Signal Characteristics
Signal Properties
Property Impact Significance Amplitude Strength Detectability Width Resolution Accuracy Shape Quality Reliability Timing Distance Measurement Influencing Factors
- Material properties
- Surface conditions
- Tank geometry
- Process conditions
Signal Processing
Analysis Methods
- Peak detection
- Signal filtering
- Noise reduction
- Pattern recognition
Quality Factors
- Signal-to-noise ratio
- Echo reliability
- Measurement stability
- Resolution capability
Understanding signals improves measurement reliability.
How to Calibrate a Radar Transmitter Using Echo Curves?
Proper calibration using echo curves ensures optimal performance.
Calibration involves analyzing echo curves to set appropriate thresholds, map false echoes, and verify measurement accuracy across the operating range.
Calibration Using Echo Curves
From my calibration experience:
Calibration Process
Setup Steps
Step Action Purpose Initial scan Baseline Reference Echo mapping Interference Elimination Threshold setting Detection Accuracy Verification Confirmation Reliability Parameter Adjustment
- Gain settings
- Detection thresholds
- Filter parameters
- Output scaling
Optimization Techniques
Fine-tuning
- Signal optimization
- False echo suppression
- Noise reduction
- Response time
Validation
- Multi-point checking
- Repeatability testing
- Documentation
- Performance monitoring
Echo curve analysis ensures proper calibration.
Conclusion
Understanding and properly interpreting radar echo curves is essential for accurate level measurement. Proper analysis of echo curves enables effective troubleshooting, calibration, and maintenance of radar level transmitters.